18 Apr 12 Customer Engagement Metrics for SaaS
Blog by Oluwasegun Oke
How successful the tracking of customer interactions across each customer engagement journey is can either mar or complement your SaaS brand’s offers. Considering that a staggering 5 to 25 times of effort is recommended if your attempt is to acquire new customers, as opposed to keeping existing ones engaged.
With that said, there are a few customer engagement metrics tools that can optimise your overall customer engagement, whether or not things are looking up. After all, there will always be some degree of churn rates to attend to in your desperate attempt to identify missing links and proceed to the next phase of your business.
In such cases, your company’s effort has to be more focused on devising strong marketing solutions to support all the way. Hence, we intend using this blog as a complete guide on how to fix both traditional and emerging customer-centric issues, by introducing you to the right metrics, best-suited for increasing customer success rate.
But before we get to that, a firm look into what customer engagement is all about will give you a sound overview of what to expect with the right customer engagement metrics in mind.

What is Customer Engagement?
It is the open and blunt relationship between a customer and a brand. In most cases, it is intricate and often the first point of call that determines if business activities can continue in a specific direction or be diverted for other alternatives through strategic customer-centric means.
For instance, not keeping up good customer relations after a product flop or low performance issues will be accompanied by serious criticism, negative reviews, or even customer churn.
This vital concept (customer engagement) must therefore be constantly monitored or tracked using different tools such that checks and balances are engaged or encouraged.

What are Customer Engagement Metrics?
It measures the overall outlook of your customer satisfaction journey as it relates to the business strategies you’ve undertaken.
That said, a good business strategy will definitely pull favorable customer engagement metrics as against a poorly conceived one.
How to Recognise the Right Customer Engagement Metric for a Particular Product or SaaS Features

To sum up, it can be overwhelmingly intimidating if nuances inherent in finding the right metrics for any SaaS brand is put into perspective. In essence, while some apps user engagements for instance can be easily measured due to increased level of usage (big data-facilitated), others are far-fetched because they do not required long usage (small data-facilitated) to improve their value addition.
Further, since identifying the right metrics also include the knowledge of value addition, it becomes problematic and time-sensitive for an average SaaS firm to come to terms with the best way to generate personalised metrics that can improve engagement rates and increase productivity.
Customer Engagement Metrics
Here, we intend looking into twelve types of customer engagement metrics, and how they can be leveraged to increase value addition for high growth curves.
- Session Time or Average Session Duration

It is the measurement of those moments users were actively engaged, based on the account of the optimisation of the engagement level during the individual length of time each spent interacting with such SaaS products. Some apps for instance also take into account “visit frequency” in a bid to determine how productively engaged their users are.
It is a well streamlined strategy to capture users activities in realtime with the view to understanding the exact duration of time during which value is added, in order to limit different customer engagement metrics according to the SaaS product they help to engage.
- Churn Rate

It is the overall rate at which customers are choosing to stop their SaaS product subscriptions or leave, so that you can register their needs or grievances and apply checks and balances in subsequent marketing efforts.
Although few cases of customer churn is caused by accumulating those who obviously have other needs or are happy with the level of value addition, otherwise, churn rate is a foremost metric or the most desirable if priority must be attached to your customers’ interests, and how they feel about your SaaS products.
- Customer Lifetime Value

The overall revenue contributions accruable from engaged premium users of any particular SaaS product is either a testament to an increased revenue or impressive customer base or that things are not picking up at all and users engagement is dropping.
This helps you to pinpoint exactly where the shoe pinches and make adjustments accordingly.
- Net Promoter Score (NPS)
It is foremost when it comes to designed tools used in gauging customer satisfaction or loyalty level in order to put in place measures that can limit subsequent churn rates to the barest minimum.
It therefore allows SaaS brands to make informed or constructive decisions after sending surveys to directly make a positive Impact on productivity.
A typical survey question is, ” How likely are you to recommend us to family and friends?”. With values ranging from “Not Like at All” (0) to “Extremely Likely” (10)
Respondents who chose between 9 and 10 are called Promoters, while those who selected between 0 and 6 are referred to as Detractors.
With the overall Net Promoter Score (NPS) given by the following calculation:
NPS = {(Promoters – Detractors) divided by total number of respondents} × 100 percent
- Core User Actions
It includes all the routine tasks or activities that are common to a specific SaaS product. In the sense that it demonstrates if a user’s values are optimised or not. Therefore, to really understand this concept, we have to go back to how most SaaS solutions are aimed at developing customer-centric features, and in some cases alongside jointed applications.
If the above jointed applications are faulty, for instance, value addition is negatively impacted. This is why products with unique core user actions get to enjoy positive reviews, thereby changing the fortune of their existing client base for the best.
- Page Views
It is the updated number of people who have visited your website, including those who are revisiting, plus the reloading attempts or people visiting for the first time.
In a nutshell, being equipped with this knowledge of how engaged your brand pages are further empowers involved SaaS brands to make far-reaching business decisions that can accelerate growth.
- Customer Satisfaction Score Survey (CSAT)
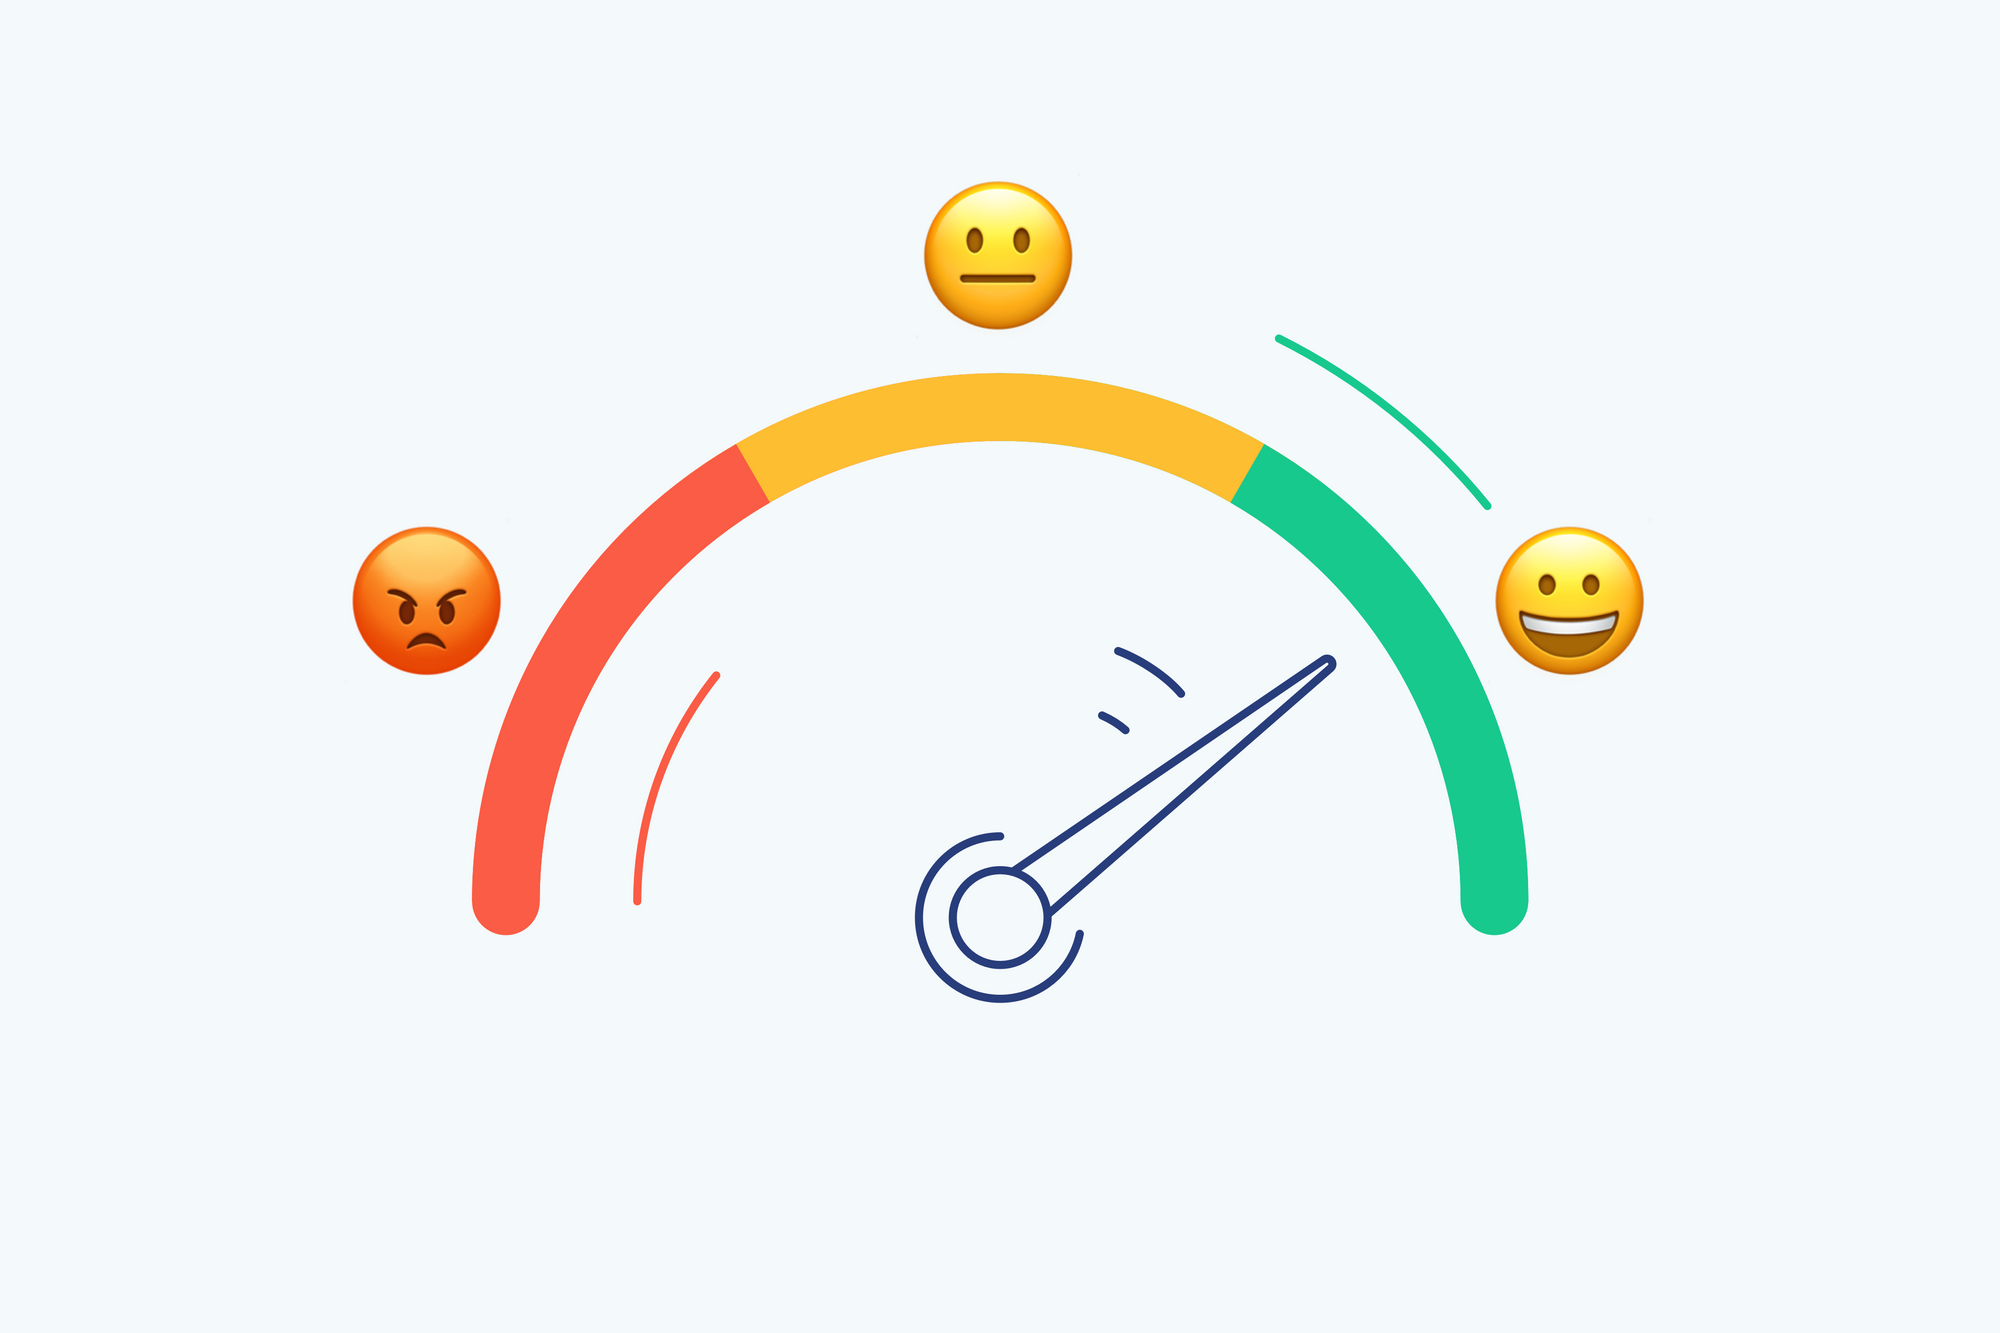
It is a better version of NPS, as a proven tool used in gauging the level of customer satisfaction. As it a focal point on how engaged satisfied users are while interacting with the concerned products’ wide varieties of features. Not excluding as it relates to emerging pricing issues, renewal dates, purchases, including how to optimise the customer service.
Also, unlike NPS which usually stops at how spontaneous users are likely to recommend the particular SaaS product. Most importantly, CSAT allows for the received customer survey feedback to be followed up with more questions to reveal further insights into the reason behind their chosen preferences.
With 1 to 5 being the point-scale reached between minimum and maximum scores.
CSAT Score = {(Total Number of 4 to 5 ratings) ÷ (number of total responses)} × 100% = Percentage of Satisfied Customers
- Feature Usage
A metric that gives you the underlining impressions as it relates to the level of user interactivity with the SaaS product features. Having this knowledge is a great way to ascertaining how their engagement was well connected to create value addition.
- Visit Frequency or Usage Level
How high the frequency that customers sign into your product platform, at any point in time, is a reference point that is powerful. If you can come to terms with the recommended usage level for such a product, in the first place. Considering that big data are most suitable for identifying useful and insightful patterns. However, rarely used platforms (having big gaps between their user engagement durations, eg 2001, 2005, 2015, and so on), — such as hiring and onboarding ones — are at a disadvantage at this end.
However, the brands that fall within the above groups usually devise other means of extracting useful and insightful patterns, in such a way that user experience is as also impacted, with correlative value addition.
With this in mind, platforms that are heavily signed into (with small gaps of seconds, hours, or at most days between their user engagement durations) however enjoy heavy user visit frequencies. Hence, offering a more robust mode with instant access to useful frequency patterns that such SaaS brands can in realtime use to conceive new ideas and initiatives.
- Bounce Rate

A useful metric if you are looking to convert prospects into long-term audiences. Because it is a one-stop tool that empowers website administrators to get the much needed insights into the comparative levels of the number of visitors who were not moved by the vision, objectives among others, guarding the SaaS brand’s initiatives.
Although very few numbers of the above customers usually come about as a result of mismatched interests, raised by either side. But on the overall scale, bounce rate is as effective as the sun can be if that weather is truely heating up.
And if understudied, the so generated insights easily correspond to increased client base in the end.
- Customer Effort Score (CES)
It is a designed metric for improving the way customers interact with your SaaS products or features. In the end, the centralised intension is to keep up every user engagement end and set you up for a leading role.
In such cases, customers can ignore their previous needs for strain tolerance requirement and just get lost in the impressive level of product optimisation.
While on the reverse, poorly designed products can be unproductive, and should be approached and fixed as revealed by the CES calculation results.
Most importantly, the scores are arrived at by asking respondents pertinent questions with regard to how much of ease so involved as they interact with the product features.
CES Score = Total sum of responses ÷ Total number of responses
- New users Activity Levels
It is a metric with optimized potential to reveal not just the rate at which new users are engaged within the first week or at most the so desired timeframe, as it also gives you the true nature of your investment.
For instance, the SaaS product with the most Realtime unique features should be able to retain the highest number of engaged users within the first-week timeframe under consideration, while others can then follow suit in the descending order.

